
10 Jobs AI Will Erase by 2030
— And the Reversal No One’s Covering
Forrester’s January 2026 forecast: 10.4 million US roles gone in four years. But 55% of employers already regret their AI layoffs, with half quietly rehiring. The deployment failure story is more important than the prediction.
Half the layoffs are coming back.
That’s the finding most 2026 job-displacement lists skip because it complicates the narrative. Forrester’s January 2026 AI Job Impact Forecast — projecting 10.4 million US roles displaced by 2030 — includes a buried finding that doesn’t make headlines: roughly half of companies that executed AI-driven layoffs reversed them within 18 months, through offshore rehiring or lower-salary replacements. The net displacement number is real. The timeline is not.
Klarna laid off 700 customer service staff in 2024. Quality declined. Customers revolted on social media. The company quietly began rehiring. Salesforce cut 4,000 support roles; CEO Marc Benioff admitted publicly that AI handles only 50% of conversations — humans still own the other half. These aren’t edge cases. They’re the early-mover lesson the late majority gets to learn from.
“Companies aren’t replacing humans with AI. They’re announcing it before they’ve verified the technology works — then reversing quietly three quarters later.”
Editorial synthesis — sources: Forrester AI Job Impact Forecast (2026), Oxford Economics Labour Market Analysis (Jan 2026)
Oxford Economics’ January 2026 analysis puts a sharper point on it: AI was cited in 55,000 US job cuts in 2025, representing just 4.5% of total layoffs, while market conditions accounted for 245,000 cuts — that’s 21%. Their conclusion is blunt: companies are “dressing up layoffs as good news” rather than admitting weak demand or past overhiring. Tier 2 — established outlet, investor-facing publication
The MIT finding that only 5% of companies going all-in on AI demonstrate profitable returns, combined with Forrester’s 55% regret rate and Oxford Economics’ deployment-reality data, produces a finding none of the three contains individually: we are in a window where most AI layoff announcements are made before companies understand what they’re automating. The Klarna and Salesforce reversals aren’t anomalies. They’re the leading indicator of what happens when board pressure to announce AI strategy meets production reality. Visier, the people analytics firm, found rehiring rates at end-of-2025 hit their highest level since 2018 — companies are reversing AI layoffs faster than they’re making them. Tier 3 — Visier is a commercial analytics vendor; no independent audit of their rehiring figure was found. Treat as directional.
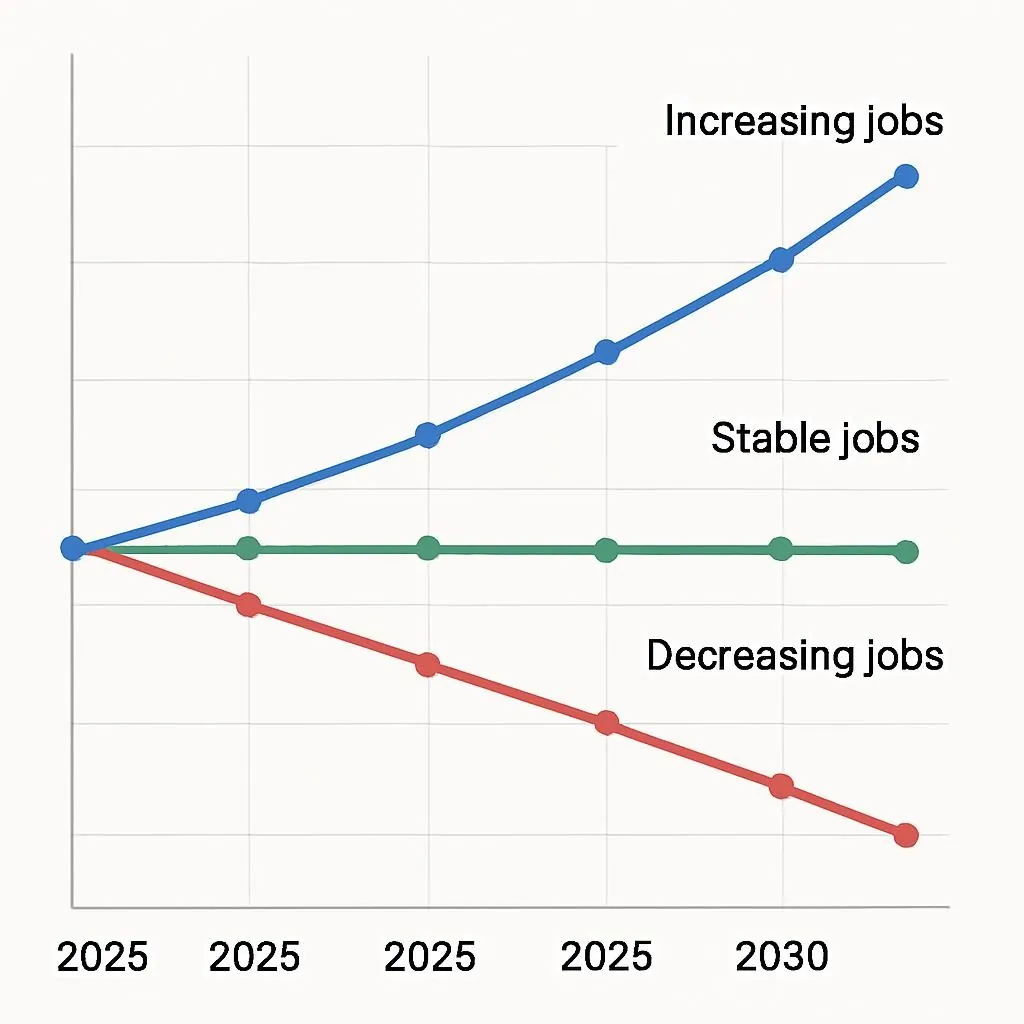
The implication: the 10.4 million Forrester figure describes a genuine long-run trajectory. It does not describe an orderly 2026 event. Real displacement concentrates in 2027–2029, once companies have sorted out what actually works at scale.
The Complication: Why Doesn’t the Productivity Data Agree?
Here’s the part that complicates the whole thesis.
If AI were genuinely replacing human labor at scale, output per remaining worker should spike. It isn’t. Oxford Economics’ analysis notes this gap explicitly — and names three possible explanations: deployment is failing more broadly than reported, workers are less productive than companies claim, or we’re measuring the wrong outputs entirely. That uncertainty isn’t resolved in 2026. It matters because it determines whether 2030 losses land at 10 million or 100 million.
AI deployment failures present identically to successes in the short term. A customer service bot handling 50% of tickets looks like progress on a dashboard until you see the CSAT scores six months later. The monitoring systems that executives use to justify layoffs were designed to catch efficiency gains — not to catch model failures that look like business successes during the quarter the cuts are announced. This is why reversal rates are high: the signal that something’s wrong arrives after the PR around the layoff is already done.
The Framework: Automation Feasibility vs. Deployment Success
Most lists say “AI will eliminate X job” because the technology theoretically can handle the tasks. That’s like saying “autonomous vehicles will eliminate trucking jobs” because Level 5 autonomy exists — while ignoring that Cruise shut down and Waymo operates commercially in three cities. You need two things for genuine displacement:
Technical feasibility: Can AI handle 70%+ of the tasks in the role?
Deployment success: Are companies actually implementing this at scale without reversing?
Both have to be true. That’s what this list tracks.
| Role Category | Automation Feasibility | Deployment Status | Timeline | ⚠ Adversarial: What Could Stall This |
|---|---|---|---|---|
| Data Entry / RPA tasks | Strong — 90%+ automatable | Already at scale in fintech, insurance | 2026–2027 | Edge-case handling still requires human review in regulated industries; errors have legal consequences |
| Tier-1 Customer Support | Strong — routine queries 80%+ automatable | Mixed — Klarna reversal is the cautionary data point | 2026–2028 | CSAT degradation takes 2–3 quarters to manifest; companies re-hire before full cost is visible |
| Medical Transcription | Strong — 98%+ speech-to-text accuracy achieved 2024 | Already happened 2023–2025 | Done | HIPAA compliance overhead creates niche human roles in error correction and audit |
| Junior Dev (routine coding) | Moderate — task-level, not job-level automation | BLS data: programmer employment −27.5% (2023–2025); software developer −0.3% | 2027–2028 | Senior engineers using AI are 10x more productive — may expand total output rather than cut headcount |
| Middle Management (reporting) | Moderate — scheduling, analytics automatable; people management not | High regret rate — overrepresented in Forrester’s reversal data | 2026–2028 for report-heavy roles | Relationship management, conflict resolution, mentorship proving non-automatable at cost executives assumed |
| Basic Accounting / Bookkeeping | Strong — invoice processing, expense categorization are rules-based | RPA + LLM combinations in production | 70% automated by 2029 | Tax strategy, audit prep, financial judgment — these roles grow as routine work shrinks; net firm headcount may hold |
| Paralegals (document review) | Strong — LLMs excel at contract analysis and discovery | Slow adoption due to liability; 3x speed improvement requires attorney verification | 60% of document review automated by 2028 | Legal industry moves at litigation pace, not tech pace; malpractice exposure slows firm-level adoption |
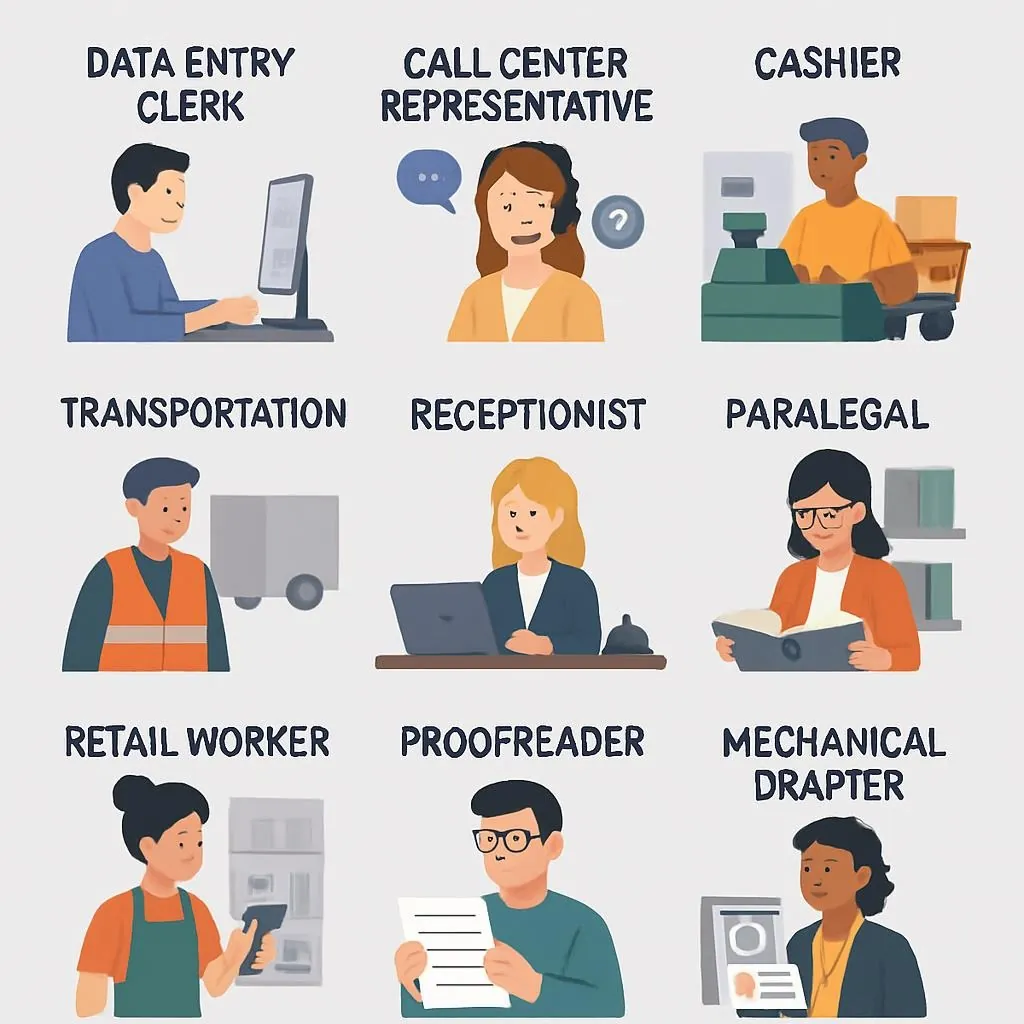
The 10 Roles, Ranked by Real Displacement Risk
RPA combined with LLM-based verification is standard-issue in fintech and insurance right now — not a pilot, not a roadmap item. Tasks are 100% routine, screen-based, rules-driven. Perfect AI territory and, critically, low enough stakes that companies aren’t reversing these implementations the way they reversed customer service cuts.
The WEF Future of Jobs Report 2025 estimated AI will replace 92 million jobs by 2030 (across the global economy), with data entry roles among the first wave. Tier 1 — WEF report, aggregated survey methodology, global not US-specific
Forrester found that generative AI accounts for 50% of AI-related job losses, with customer service as the primary target. Geoffrey Hinton — described widely as the “godfather of deep learning,” speaking at MIT in March 2025 — cited call centers as roles AI “can already largely replace.” The catch: this is tier-1 only. Password resets, order status checks, FAQ routing. The Klarna reversal happened precisely because companies lumped complex troubleshooting into the same automation wave as routine queries.
Speech-to-text accuracy crossed 98% in 2024. American Medical Association data puts 40% of medical coding on track for automation by end of 2025. This displacement is largely complete. If you’re currently in this role, the transition conversation is not hypothetical. AMA — professional association, potential advocacy bias; figure consistent with independent health IT reporting
Voice AI crossed the uncanny valley for brief interactions in late 2024. Most people in standard testing can’t reliably distinguish AI voices in sub-90-second outbound calls. Outbound cold-calling is highly automatable — the value was never the human voice, it was the script. Complex negotiations and inbound sales relationships remain human-dominated through 2030, at minimum.
The technology works. The deployment is messy. Multiple retailers tested fully automated checkout in 2024–2025 and added humans back within months — not because the AI failed but because shrinkage rates spiked and customer friction in older demographics was higher than modeled. Amazon’s Just Walk Out tech retreated from non-Amazon grocery environments. The automation wave is real; the timeline is 2027–2029 for most mainstream retailers. High-end and elderly-focused stores retain humans longer — by design, not necessity.
LLMs excel at contract analysis and e-discovery. Document review automation demonstrably improves speed — 3x is the figure practitioners cite most, though this is from production deployment accounts rather than controlled studies. The legal industry moves slowly due to liability. Attorney verification remains mandatory. Client interaction, court appearances, strategic counsel — all human through 2030.
See our dedicated legal sector analysis for a deeper breakdown by practice area.
US Bureau of Labor Statistics data shows programmer employment fell 27.5% between 2023 and 2025; software developers (the design-architecture tier) fell only 0.3% in the same period. Tier 1 — BLS, federal agency, QCEW methodology, well-established That’s not a coincidence. Architecture, complex debugging, system design — these remain human-dominated. Hinton noted AI “can do in minutes what used to take an hour” for coding tasks. That’s tasks, not jobs. Senior engineers using AI are orders of magnitude more productive; entry-level engineers who don’t use it get squeezed from both ends.
Routine transactions are 90% automatable. Branch closures are accelerating — but not eliminating. BLS projects US bank teller employment to fall 15% by 2032 as digital banking grows. Complex transactions, fraud resolution, mortgage conversations — these remain human-staffed, and they’re the interactions that drive deposit retention. Banks know that. The math on the remaining human roles actually gets better as the routine work disappears.
Invoice processing and expense categorization are rules-based. RPA plus LLM combinations handle this reliably in production. McKinsey’s sector automation modeling puts 54% of banking-adjacent finance jobs at high automation potential. Tier 2 — McKinsey, commercial firm with consulting revenue tied to AI adoption narrative; treat as directional for precise figures Tax strategy, audit preparation, financial modeling — these require judgment that current models can’t replicate at production quality. Strategic roles grow as routine work disappears. Accounting firms aren’t shrinking; they’re restructuring headcount toward higher-margin work.
Gartner predicted in 2024 that 20% of organizations will use AI to flatten hierarchy, eliminating 50%+ of middle management by 2026. Tier 2 — Gartner, commercial research firm; methodology not independently audited; treat as directional Here’s the thing: this is where Forrester’s 55% regret data shows the highest concentration of reversals. AI automates scheduling and reporting well. It doesn’t automate the thing that makes management functional — conflict resolution, mentorship, reading the room when someone’s about to quit. Companies that cut this layer in 2024–2025 are spending 2026 figuring out how to rebuild it at lower cost. They haven’t solved it yet.
Your Personal Risk Audit
Twenty minutes. Not aspirational — this is the actual diagnostic. List 10 to 20 tasks you do weekly. Tag each one.
Task Classification Framework
- Repetitive, rules-based
- Computer work, minimal judgment
- Data entry, report generation
- Scheduling, status updates
- Template-based writing
- Complex problem-solving
- Ambiguous inputs, strategic decisions
- Novel analysis, synthesis
- Design, architecture
- Persuasion, negotiation
- Physical presence required
- Emotional intelligence
- Relationship management
- Crisis response
- Care, mentorship
A marketing manager who spends 70% of their week scheduling posts and running basic analytics is high risk. A marketing manager who spends 70% on strategy, creative direction, and client relationships — same title, completely different exposure. The role label is almost irrelevant. The task distribution is everything.
5 Roles AI Is Actually Creating (2025–2026 Data)
Autodesk’s 2025 analysis of 3 million job listings found AI mentions in postings surged 56.1% year-over-year. Q1 2025 produced 35,445 AI-related positions in the US — 25.2% more than Q1 2024. Tier 2 — Autodesk, commercial software vendor; methodology covers job postings, not filled positions; treat growth percentages as directional
AI Engineer
Building and deploying production AI systems — MLOps, infrastructure, integration. Not data scientists. Engineers who understand how to keep models running at scale. Median salary $156,998 in Q1 2025 per Autodesk’s data. Self-reported job listing data; salary figures from posting analysis, not compensation surveys
Prompt Engineer
Designing effective LLM prompts and optimizing enterprise AI workflows. Skepticism warranted: by 2028 this likely becomes an expected competency, not a standalone role — the same way “Excel skills” moved from job title to checkbox. Ride it while it’s a distinct market.
AI Ethics & Governance Lead
EU AI Act enforcement started February 2025. Companies are scrambling to add compliance capacity. This might be the rarest thing in any job market: demand that genuinely outpaces trained supply through 2030. Every AI implementation needs governance; almost no one has trained for it. See our EU AI Act compliance guide.
AI Content Creator
Managing AI-generated content at scale while maintaining brand voice. This isn’t replacing writers — it’s a new category. The people who understand both the brand voice and how to get LLMs to hit it consistently are worth real money to mid-market companies that can’t afford full content teams.
MLOps Specialist
Deploying a model is 10% of the work. Keeping it running reliably — monitoring, retraining, version control, drift detection — is 90%. Models degrade. They break in production in ways that weren’t visible in testing. The people who understand this at a systems level are in shorter supply than the models themselves. Full MLOps career breakdown here.
“Workers with AI skills earn 56% more than peers in identical roles. In marketing and sales, that gap averages 43%. In non-tech HR functions, 35%. This isn’t an engineer story.”
PwC 2025 Global AI Jobs Barometer — 22,000 workers surveyed across 54 countries (Tier 1)
An operations analyst who uses AI to automate reports is three times more valuable than one who doesn’t — and more valuable than AI alone, because the analyst provides the institutional context the model doesn’t have. That’s the actual leverage play for most knowledge workers right now.
3 Transition Strategies (Operational, Not Aspirational)
Skill Pivot: A-Tasks to B-Tasks
Map your current A-tasks to adjacent B-tasks in the same domain. Data entry → data analysis and insight generation. Customer service → customer success and retention strategy. Basic coding → system architecture and technical leadership. Five to ten hours per week for twelve weeks. Employers value domain knowledge plus elevated skills over pure credentials — you have the domain. Get the elevation.
AI-Augmented Positioning
Become the human who manages the AI. Week one and two: learn prompt engineering in your specific domain. Week three: build three automation projects using existing tools. Week four: document ROI and pitch internally as “AI Operations Specialist.” An accountant who automates 60% of bookkeeping with AI and pivots to “AI-Assisted Tax Strategist” can serve three times the clients at twice the rate. The math works.
Contrarian Bet on Human-Essential
Healthcare and social assistance added 385,000 jobs in Q1 2025 alone. AI chatbots attempted mental health counseling in 2023–2024; results were genuinely bad. Skilled trades — plumbing, electrical, HVAC — have physical presence as a moat that no language model touches. In-person education. Elder care. Physical presence and emotional intelligence aren’t exceptions to the automation wave; they’re the wall it breaks against.
The task audit is the only thing that matters right now
Look, here’s what this actually is for you: not a prediction list, but a task audit you do before your next performance review. The 2026 labor market is weird — Forrester’s reversal data means your job might not disappear on the timeline the headlines suggest. But the window to reposition is shorter than the timeline implies. Companies executing 2026–2027 headcount decisions are looking right now at which roles are A-task-heavy. You want to not be that person when the decision gets made.
What you do: Spend two hours this week doing the A/B/C task audit above. If you’re 60%+ A-tasks, spend the next four weeks building one visible B-task output — an insight, a synthesis, a process improvement — and make sure your manager sees it. Not to impress anyone. To change what they associate your name with.
Here’s what’s going to stop you: The audit feels abstract until you sit down and do it task by task. Most people skip it because listing your own work feels tedious. It’s tedious. Do it anyway.
The regret data is your planning input
Here’s what this actually is for planning purposes: Forrester’s 55% regret figure isn’t a morale story, it’s a budget story. The companies reversing AI layoffs are spending 2026 on replacement hiring — at lower salaries, which creates new risks — or they’re rebuilding with contractors, which costs more. The net-cost calculation on AI-driven headcount reductions is materially worse than the Q4 presentation made it look. That’s specific to the planning cycle you’re operating in right now, not a general observation.
What you do: Before any AI-attributed headcount decision, run a 90-day CSAT and output quality lag analysis. The Klarna signal didn’t arrive for two quarters post-cutover. Build in the measurement delay before you announce.
Here’s what’s going to stop you: Board pressure for AI efficiency announcements is real and has its own timeline. The analytical case for caution is strong; the political case is harder. The regret data helps — frame it as “avoiding the Klarna outcome” rather than “slowing AI adoption.”
What the Data Doesn’t Resolve
Oxford Economics names the productivity gap explicitly: if AI were genuinely replacing humans at scale, output per remaining worker should be spiking. It isn’t. That could mean deployment is failing broadly, workers are less productive than claimed, or we’re measuring wrong. The data doesn’t resolve which. That gap determines whether 2030 losses land at 10 million or 100 million — and it’s not answered in any source cited here.
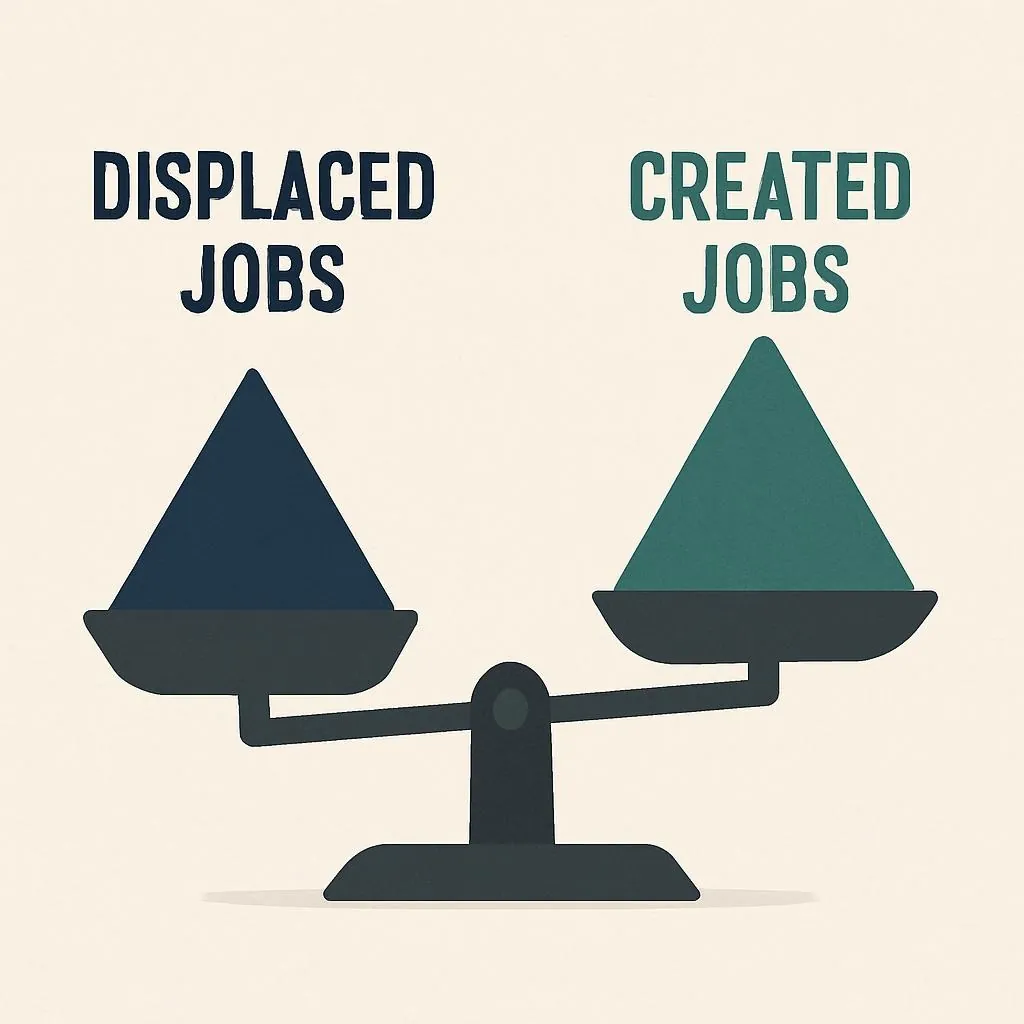
The WEF estimates 92 million displaced but 170 million jobs created between 2025 and 2030 — net positive 78 million. WEF projections at this timescale have historically underestimated volatility; treat the net figure as directional Which new jobs? “AI Ethicist” and “MLOps Specialist” are real roles. Do they scale to tens of millions? Not on current trajectory. The reskilling question is genuinely unresolved: only 23% of AI decision-makers reported their organizations offered prompt engineering training in 2025. Everyone talks about reskilling; almost nobody funds it at scale. Whether that changes by 2028 determines whether displaced workers transition or get permanently squeezed out of the labor market.
“The 10.4 million figure is real as a long-run trajectory. It is not an orderly 2026 event. The companies that will drive most of that displacement are still figuring out what actually works.”
Editorial synthesis — sources: Forrester AI Job Impact Forecast (Jan 2026), MIT productivity study (2025), Visier rehiring data (Q4 2025)
Real displacement concentrates 2027–2029. Early movers reversed mistakes. Late majority learns from them. By 2028 we’ll know which automation scales and which is still a Q4 slide.
Smart Glasses Will Replace Your Phone — Here’s the Real Timeline
5 Future Skills That Will Make You Filthy Rich in 2025
AI Jobs 2026: Why Regional Data Tells a Different Story Than Global Headlines
Why AI Will Reshape Banking by 2030—Precision Agentic Transformation
Future Side Hustles That Pay More Than a Job
AI Economy: 10 Jobs That Will Pay $200K in 2026
1 thought on “10 Jobs AI Could Transform by 2030”