

The Greatest Trade in Financial History
A Single Prediction Made Billions — Here’s What It Was
In 2007, one man saw what virtually every bank, regulator, and institution on Wall Street refused to see. His prediction wasn’t just right — it earned $15 billion and permanently changed how the world thinks about risk.
Who Was John Paulson Before This Trade?
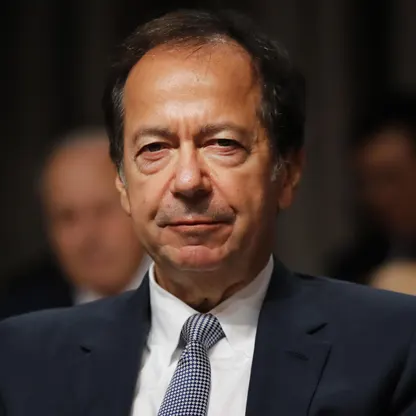
Here’s what makes the story strange from the start: John Paulson was not a visionary. Not then, anyway. By the mid-2000s, he’d spent nearly two decades running a respectable but unremarkable merger arbitrage shop in New York. Paulson & Co. was solid — steady, professional, good at exploiting small pricing gaps around corporate deals. But it wasn’t in the same conversation as the big macro hedge funds. Nobody was writing profiles about him.
He had a background in M&A, not real estate. He had no deep experience in structured credit, no particular track record in derivatives, no obvious reason to become the man who would eventually outfox the entire financial system. As journalist Gregory Zuckerman put it in his definitive account, The Greatest Trade Ever, Paulson was “an also-ran on Wall Street” before 2007. His personality tests with potential investors apparently came back unflattering. He once failed to get a meeting past a junior gatekeeper.
This context matters enormously. The trade that made $15 billion wasn’t the work of a pre-established genius working within his known domain. It was the product of an ordinary (by hedge fund standards) manager who forced himself to look at a market he barely understood, found something no one was talking about, and had the stubbornness to stay with it for over a year while losing money.
The Signal Everyone Else Was Ignoring
The housing boom of 2004–2006 was, in retrospect, an almost comically obvious bubble. But that’s the problem with obvious bubbles: they’re only obvious afterward. While they’re inflating, they come dressed as normal economic progress. Housing prices rising 7% a year, every year. Interest rates low. Credit flowing to anyone who asked. Wall Street packaging mortgages into securities and selling them to pension funds and foreign banks who were themselves happy to accept ratings from agencies that barely understood what they were rating.
By the Numbers: The Subprime Market in 2006
The subprime loan market had grown to approximately $1.2 trillion by end of 2006 — roughly 10% of the overall US mortgage market.
Through CDO structuring, more than $5 trillion in risky investments had been synthetically created from those underlying subprime loans.
Between 2000 and 2005, US home prices had risen at over 7% annually in inflation-adjusted terms. Between 1975 and 2000, the same figure was just 1.4% per year. Paolo Pellegrini’s chart of this divergence became the intellectual foundation of the entire trade.
Paulson arrived at his thesis through an unusual path. In late 2005, he was hunting for portfolio protection — puts on the S&P 500 — but found them too expensive. That search led him toward credit default swaps on mortgage-backed securities. The premiums were remarkably cheap. The market was essentially telling him that a broad collapse in residential mortgage bonds was nearly impossible. Paulson thought the market might be wrong.
What he saw, looking at the underlying loan data: mortgage brokers originating loans to borrowers who manifestly couldn’t repay them. 100% loan-to-value. No income verification. Teaser rates that would reset sharply in two to three years. As he described it later, the underwriting standards had simply collapsed — “a borrower with no credit history, a horrible credit rating, a history of never paying money back, and no cash to put down could borrow 110% of the purchase price of a house.” He wasn’t the only one who noticed. But he was one of the very few willing to act on it at meaningful scale.
The Analyst Who Found the Number
The intellectual core of the trade didn’t actually come from Paulson himself. It came from Paolo Pellegrini — an Italian-born analyst who had graduated top of his class at Harvard Business School, worked at Lazard, and then proceeded to fail at almost everything he touched for the next two decades. By 2005, he was looking for any job he could get. Paulson offered him a position as a junior analyst, barely above entry level, mostly as a favour to a shared contact.
Pellegrini went to work. He built a simple chart of US home prices going back to 1975, adjusting for inflation. The line was nearly flat for twenty-five years, then spiked sharply upward from 2000 onward. The conclusion was not subtle: if prices reverted to any historical norm, the losses embedded in subprime mortgage securities would be enormous. The question was never if — it was when.
“It was like a very simple physics problem. If house-price growth kept slowing and went negative, and loan delinquencies kept rising, at some point the mortgage market would collapse and these mortgage-backed securities would sustain losses.”
— John Paulson, from Gregory Zuckerman’s “The Greatest Trade Ever”That simplicity was, counterintuitively, part of why almost no one else was making the trade. Sophisticated Wall Street participants had become so used to complex models — multi-factor risk models, Gaussian copula functions, tranching structures — that a basic historical mean-reversion chart felt insufficiently clever. It looked too obvious to be true. The irony is that the complexity was the problem: it had obscured what a simple eye could plainly see.
The Instrument: Why Credit Default Swaps?
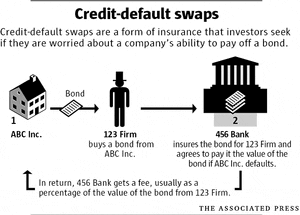
You don’t need to understand the full mechanics of credit default swaps to grasp why they were perfect for this trade. Think of a CDS as an insurance policy. You pay regular premiums to a counterparty; if the underlying bond defaults, they pay you the face value. In 2005 and 2006, premiums on mortgage-backed securities were extraordinarily cheap, because virtually no one believed these bonds could fail at scale. The ratings agencies had blessed them. The banks selling them had their own capital committed. Why would they blow up?
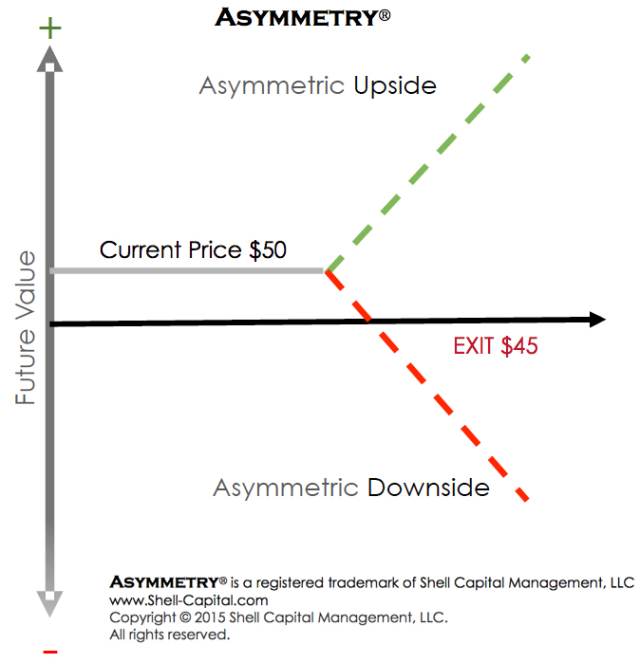
The asymmetry here was almost embarrassing in retrospect. If Paulson was wrong, he’d lose the premium payments — a manageable, defined cost. If he was right, the payout would be many multiples of his investment. He was buying catastrophe insurance on events that the entire financial system had collectively priced as near-impossible. He paid about 1–2% annually in premium costs for protection that would eventually pay 80–100 cents on the dollar when the underlying securities collapsed.
Asymmetric Risk: How the Structure Worked
Cost if wrong: Annual CDS premium payments, typically 1–2% of notional value — a known, bounded loss.
Payoff if right: Full notional value of the defaulted security, potentially 50–100× the premium paid.
One specific example: Paulson’s $22 million bet against Lehman Brothers ultimately paid out over $1 billion when Lehman collapsed — a return of approximately $45 for every $1 invested.
The structure also made it relatively easy to scale. Unlike shorting stocks — which requires borrowing shares and faces the risk of an unlimited squeeze — CDS contracts had defined maximum losses. You could put on an enormous position without worrying that a short-covering rally would wipe you out. The downside was truly capped. The upside was, as it turned out, historic.
Building the Position Under Ridicule
This part of the story is the one that gets glossed over in the breathless retellings. Paulson wasn’t just right — he was right and wrong simultaneously for a long, uncomfortable period, and staying with the trade required genuine psychological fortitude.
In 2006, he tried to raise a dedicated fund to execute this strategy at scale. His pitch: housing is a bubble, subprime mortgages are going to fail in large numbers, and he had a cheap way to bet on it. The reaction from potential investors was cool at best. The arguments against him were reasonable-sounding at the time: the contracts were illiquid, the government would act to prevent any systemic collapse, housing had never fallen nationally in the postwar era, the losses were already priced into the spreads. Even investors who were skeptical of housing generally found the trade too complicated or too early.
He raised far less than he’d hoped. And then the housing market kept going up.
Through the second half of 2006 and into early 2007, Paulson’s funds were losing money as premiums bled out and no catalyst appeared. His existing investors grew nervous. Some demanded explanations. Others questioned whether he was operating outside his expertise — which, objectively, he was. Several people who understood the trade and believed the thesis nonetheless decided it was too early or too uncertain to commit capital.
Paulson held. He added to the position. He and Pellegrini continued refining their analysis. The thesis hadn’t changed, and the data kept confirming it. They were experiencing exactly what every investor who’s ever been early to a correct idea experiences: the lonely, grinding period when the world tells you you’re wrong.
The Chronology: From Thesis to Billions
When It All Came Together
The vindication, when it arrived, was almost violent in its speed. Paulson’s funds were up 66% in February 2007 alone. His investors called to ask if the number was a typo — they assumed it meant 6.6%. This was, after all, a firm known for grinding out low single-digit monthly gains in arbitrage. To go from “respectable merger arb shop” to “66% in one month” was genuinely disorienting.
By year-end, the flagship fund had returned 590%. The second fund, 353%. The firm’s total profits were $15 billion — a figure that, for context, was 15 times what George Soros earned breaking the British pound in 1992 and would stand as the largest single-year hedge fund profit in history until Citadel’s $16 billion in 2022.
Paulson personally earned approximately $4 billion, or about $10 million every single day of the year. His tax bill alone — on profits he’d deferred through a provision available to hedge fund managers at the time — exceeded the legal maximum for a single IRS check ($99,999,999). He had to write multiple checks.
The trade didn’t slow down in 2008. Recognising that the crisis would spread to the institutions that had originated and distributed the mortgage securities, Paulson pivoted. He shorted Bear Stearns, Lehman Brothers, Barclays, Royal Bank of Scotland, Lloyds. His $22 million bet against Lehman alone paid out over $1 billion when the bank collapsed in September 2008. Adding the 2008 gains to 2007, total profits from the trade exceeded $20 billion.
How It Compares to Other Great Predictions
| Investor | Year | Prediction | Profit | Outcome |
|---|---|---|---|---|
| John Paulson | 2007–08 | US housing bubble would collapse; subprime MBS near worthless | ~$20B total | Correct — greatest single trade in history |
| George Soros | 1992 | British pound overvalued within ERM; forced devaluation inevitable | ~$1B in one day | Correct — BoE withdrew from ERM Sep 16, 1992 |
| Michael Burry | 2005–07 | Same subprime thesis as Paulson; identified it earlier | ~$700M personal | Correct — but poor timing nearly ended his fund first |
| Ken Griffin / Citadel | 2022 | Macro positioning through rate surge and equity volatility | $16B | Correct — surpassed Paulson’s single-year record |
| Meredith Whitney | 2007 | Citigroup would cut dividend; massive bank write-downs coming | Not quantified | Correct — Citi CEO resigned within days |
| Meredith Whitney | 2010 | 50–100 major municipal bond defaults within 12 months | N/A | Wrong — defaults were minimal; fund later closed |
The Soros comparison is particularly instructive. Paulson’s single-year profit was roughly 15 times the amount Soros earned in his most celebrated trade. Yet Soros — betting on a fundamental structural mismatch between UK monetary policy and its ERM commitment — was operating on a very similar intellectual framework: find a policy or market structure that is unsustainable, understand the mechanism by which it must ultimately break, and construct a position with low defined downside and enormous upside if you’re right.
What Came After — The Part People Don’t Tell
The convenient narrative ends in 2007. Paulson made $15 billion, became the most famous hedge fund manager on earth, and lived happily ever after. That’s not what happened.
By 2011 and 2012, Paulson’s funds were in serious trouble. He had made a large bet on gold — predicting that the Federal Reserve’s quantitative easing would trigger significant inflation. The logic was reasonable. The bet lost billions. His gold fund lost more than half its value. His flagship fund fell sharply. Assets under management, which had reached roughly $36 billion at the peak, contracted by more than 75% over the following decade.
Important Context: What the Trade Does Not Prove
Paulson’s subprime bet does not prove that he is a uniquely superior investor. His subsequent track record was substantially negative in real terms.
It proves, more narrowly, that he constructed a single asymmetric trade with exceptional discipline and held it through an unusually painful drawdown period. Those specific skills — asymmetric structuring and psychological persistence — are genuinely valuable. But they don’t automatically transfer to the next trade.
The history of finance is full of traders who made a spectacular correct call and then gave it all back. Paulson’s story sits in that category as much as it sits in the genius category. Both things are true simultaneously.
Paolo Pellegrini, whose research arguably made the trade intellectually possible, left Paulson & Co. in December 2008 and launched his own macro fund. It returned 61.6% in 2009. His subsequent career has been lower-profile. The man who arguably found the greatest trade in history did not become a household name in the way Paulson did.
Five Principles Behind the Trade
The trade has generated a small library of lessons, some genuinely useful and some a bit too tidy. These five hold up to scrutiny:
Frequently Asked Questions
How exactly did John Paulson make $15 billion?
By purchasing credit default swaps — essentially insurance contracts — on subprime mortgage-backed securities in 2006, when those contracts were cheap because almost no one believed housing could fall. When subprime defaults surged in 2007, the bonds backed by those mortgages collapsed in value and the CDS contracts Paulson held paid out at face value. The scale of the position, built through his Paulson Credit Opportunity Funds, generated $15 billion in gross profits for the firm and roughly $4 billion personally for Paulson.
When did Paulson first have the idea for this trade?
The process began in late 2005 when Paulson was looking for cheap portfolio protection and stumbled onto CDS on mortgage securities. The foundational research — Pellegrini’s analysis showing the historical anomaly in home price appreciation — was completed in early 2006. The fund was formally launched and positions began building in mid-2006. Real profits didn’t appear until February 2007.
Did Michael Burry make the same trade as Paulson?
Yes, Burry — an obscure California-based fund manager whose story is told in Michael Lewis’s The Big Short — identified the same opportunity and began purchasing CDS on subprime securities before Paulson did, as early as 2005. Burry’s timing was slightly earlier, which made his drawdown period longer and more painful. His personal gains were substantial (his fund returned 489% between 2000–2008) but far smaller in absolute dollar terms than Paulson’s, partly because he was managing much less capital. Their stories ran in parallel, largely unaware of each other at first.
What role did Goldman Sachs play in this trade?
Goldman Sachs structured a synthetic CDO called Abacus 2007-AC1 that allowed Paulson to effectively bet against specific subprime mortgage securities while Goldman sold the opposite position to investors. The SEC later alleged that Goldman failed to disclose Paulson’s role in selecting the underlying securities. Goldman settled with the SEC for $550 million in 2010 without admitting wrongdoing. Paulson himself was not charged — his firm maintained they were always transparent about their bearish thesis.
Is this trade replicable for ordinary investors?
Not in the same form. CDS on mortgage-backed securities are institutional instruments; retail investors can’t simply buy them. However, the underlying principles — identifying structural mispricings, seeking asymmetric risk/reward, maintaining conviction through drawdowns — are applicable at any scale. What’s difficult isn’t the mechanics but the psychology: most investors cannot hold a losing position for 12+ months while peers question their judgment.
What happened to Paulson’s fund after 2009?
Performance deteriorated substantially. His large bets on gold and inflation — based on the reasonable thesis that QE would cause significant inflation — lost billions as inflation stayed contained through the early 2010s. His gold fund lost more than half its value. Peak AUM of roughly $36 billion contracted by more than 75% over the following decade. By the mid-2010s, he was returning outside capital and managing primarily his own money.
How does Paulson’s profit compare to George Soros’s pound bet?
Soros earned approximately $1 billion breaking the Bank of England on Black Wednesday, September 16, 1992 — a genuinely extraordinary trade built on a similar framework of identifying an unsustainable policy structure. Paulson’s 2007 profit of $15 billion was roughly 15 times larger in a single year. Citadel subsequently surpassed both with $16 billion in 2022, but Paulson held the record for over a decade.
What did Paolo Pellegrini get out of this trade?
Pellegrini received a bonus that made him wealthy by any conventional measure, though the exact figure has never been publicly confirmed. He left Paulson & Co. in December 2008, launched his own macro fund PSQR Capital, and returned 61.6% in 2009. He remains a lesser-known figure despite being arguably the intellectual architect of the trade — a somewhat ironic outcome given the scale of what he helped create.
Were there any ethical issues with profiting from a housing collapse?
This is a genuinely contested question. Critics argue that large-scale short positions amplified panic and contributed to the crisis’s severity, and that profiting from millions of foreclosures raises serious moral questions. Defenders argue that short-sellers were expressing a true price signal that regulators and institutions were suppressing, and that the alternative — a market with no mechanism for pricing downside risk — would have been worse. The Goldman Abacus deal added specific ethical questions about whether Paulson’s counterparties were adequately informed. There are no clean answers here.
What is the single most transferable lesson from this trade for individual investors?
Probably this: before any investment, ask what happens if you’re wrong, and what happens if you’re right. If being wrong costs you a fixed, bearable amount and being right pays you a multiple of that amount, the trade has structural merit regardless of whether you’re ultimately correct. If the payoff structure is reversed — large downside, small upside — be very careful about your conviction level. Paulson didn’t manufacture his trade through brilliance alone. He found a bet where the math was heavily in his favour even before accounting for whether his thesis was correct.
Final Thoughts
The story of John Paulson’s 2007 trade has become, in some retellings, a kind of superhero origin story — the lone contrarian who outwitted an entire corrupt system and walked away with $15 billion. The reality is more interesting and more instructive than that.
Paulson was not, in 2005, a particularly distinguished investor. He didn’t have special access to data that others lacked. He wasn’t running better models. What he had was an analyst with a chart, a risk structure that limited his downside to manageable premium payments, and an unusual willingness to look stupid for an extended period while the market moved against him.
The prediction that made billions wasn’t just the prediction that housing would fall. That was the content. The form mattered just as much: a defined, asymmetric structure that made being right enormously profitable and being wrong merely painful rather than fatal. Strip out the asymmetry, and even a correct thesis doesn’t guarantee the result.
What the trade genuinely demonstrates — and what gets lost in the mythology — is that market edges are usually not about knowing something no one else knows. They’re about being willing to construct a position and hold it when the crowd’s behaviour creates a temporary, correctable mispricing. Those moments come around. The question is whether, when they do, you have the structure and the psychological constitution to act on them.
Paulson did, once. That turns out to have been enough to make financial history — even if it wasn’t enough to make him permanently right about everything that came next.
More from FutureNow
Continue Reading
Sources & Further Reading
Where to Go Deeper
The Definitive Account
The book-length investigative account that first documented Paulson’s trade in full detail, including Pellegrini’s chart and the internal fund dynamics.
Parallel Narrative
The parallel story of Michael Burry, Steve Eisman, and others who identified the same subprime opportunity independently of Paulson.
Regulatory Record
The official SEC complaint and settlement regarding the Abacus 2007-AC1 CDO structure that enabled Paulson’s short position. Goldman paid $550M.
The definitive 662-page government report on causes of the 2008 crisis, including detailed treatment of CDS markets and subprime securitization.
Market Data & Context
Fed retrospective on the crisis timeline, including the February 2007 subprime delinquency inflection point that triggered Paulson’s first gains.
Academic working paper on the mechanics of CDOs, CDS pricing, and why the market systematically underpriced mortgage default risk.
Original Journalism
One of the earliest detailed profiles of Paulson’s trade as it was unfolding — includes the ABX index chart referenced in this article.
Pre-crisis profile of Paulson as he was building positions in 2006 — captures the skepticism and ridicule he faced before the trade paid off.
Breaking coverage of the SEC’s Abacus complaint, with context on Paulson’s role in selecting the underlying securities.
The Aftermath
The follow-up story rarely told: Paulson’s gold bets, fund redemptions, and the 75% AUM contraction in the decade after 2008.
Coverage of Paulson’s conversion to a family office, returning outside capital after years of post-crisis underperformance.
Conceptual Frameworks
Technical primer on CDS mechanics — premiums, notional value, counterparties, and how the instrument functioned in Paulson’s strategy.
Institutional explanation of the core concept that made Paulson’s trade structurally viable regardless of timing certainty.
All external links open in new tabs. FutureNow has no editorial or financial relationship with the linked publishers. Sources are selected for factual authority and historical relevance to the claims made in this article.
The Shocking Future Predictions That Already Came True
Tech Billionaires: The Wildest Future Forecasts 2026
AI Topped Billboard in 2026. Here’s What the Labels Got Wrong
The AI Tool That’s Making People Rich (2025)