

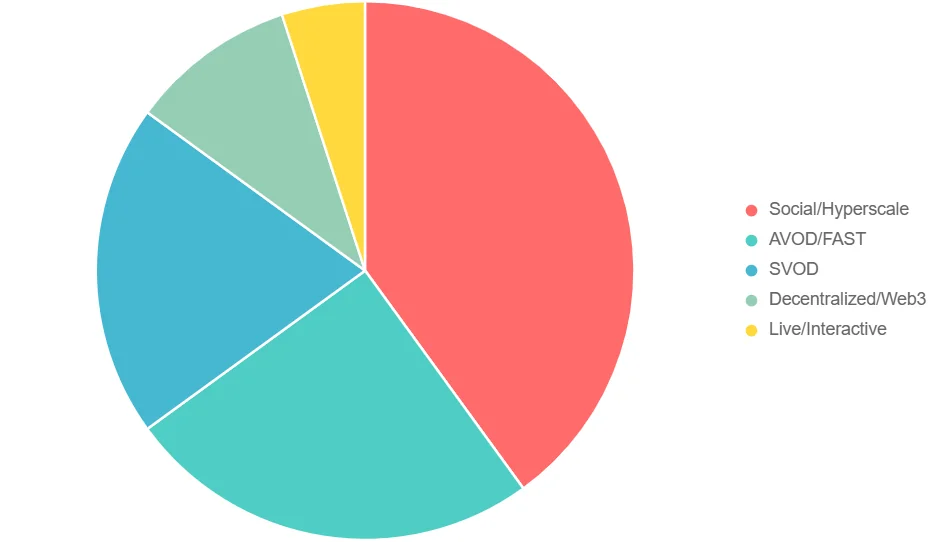

Streaming in 2025 Is an Ad Business Now.
Nobody Planned This.
The subscription era peaked. What replaced it is messier, more profitable in some places, and a genuine disaster in others. Here’s what the data actually shows.
Three years ago, the industry consensus was that subscription fatigue was temporary. Password-sharing crackdowns would fix churn. Good content would fix churn. Bundling would fix churn. Everybody had a theory. Nobody’s theory was “turn into an ad network.”
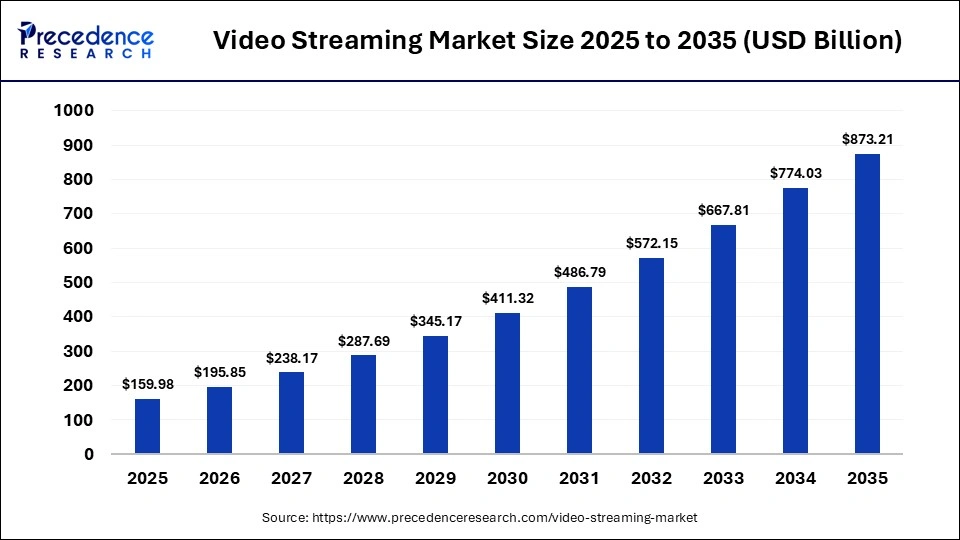
And yet. Here we are in 2026, looking at a year where Omdia pegged global video streaming at $214.6 billion — and advertising, not subscription, is the growth engine. Omdia, Oct 2025. Revenue includes SVOD, AVOD, FAST, live streaming. Omdia is an independent analyst firm; figure is proprietary model, not self-reported platform data. Premium advertising revenue across hybrid SVOD/AVOD, FAST, and broadcaster streaming hit $42.1 billion globally in 2025, up 15.6% from 2024. That’s the number that matters.
The structural shift happened faster than almost anyone predicted. In Q2 2025, ad-supported viewing claimed 73.6% of total TV viewing time in the US — a figure that includes linear and streaming combined. Nielsen Q2 2025 Ad Supported Gauge via MNTN Research. TV viewing declined 9% overall in Q2, which means ad-supported share rose partly through relative stability, not pure growth. Worth noting. That’s not a rounding error. Paid, ad-free viewing is now the minority habit.
So the question isn’t whether this is happening. It is. The question is what it actually means for the people running these platforms — and the people buying ads on them.
The Churn Story the Industry Tells vs. What Antenna Actually Found
The “5.5% monthly churn” figure that circulates in trade press — including in the article you’re probably comparing this one to — is sourced from nobody in particular. What Antenna, the actual subscription analytics company, reported in June 2025: premium SVOD churn has hovered around 5% since January 2023, and in 2025 it came in at 4.6%. Antenna, February 2026 data. Antenna tracks Apple TV+, Discovery+, Disney+, Hulu, Max, Netflix, Paramount+, Peacock, Starz. Methodology: cancellations divided by prior month’s total subscriptions.
That’s actually good news. Sort of. The better news, and the news almost nobody leads with: 34% of cancellations are resubscriptions within 12 months. Between September 2023 and August 2024, 57 million out of 169 million gross adds across premium SVOD were people coming back to a service they’d already canceled. Churn as a number understates loyalty as a concept.
“The industry spent three years treating every cancellation as a failure. A third of them are just intermissions.”
Editorial synthesis — sources: Antenna State of Subscriptions Q2 2025; Antenna Net Churn analysis, Sept 2024The complicating finding here: churn is not evenly distributed. Netflix’s gross churn in 2024 was 1.8% — one of the lowest in the industry. Starz and Peacock operate closer to 7%. Sports subscriptions spiked to 12% in February 2025, right after the NFL season ended. Antenna Q2 2025 State of Subscriptions. Sports churn cyclicality is a structural feature, not a failure mode; it reflects the seasonal nature of the consumption. Averaging those into a single “streaming churn” number produces a figure that describes nobody’s actual situation accurately.
Disney+: The Jimmy Kimmel Spike
In 2025, Disney+ and Hulu experienced churn spikes to 7.8% and 9.6% respectively during the period when Disney pulled “Jimmy Kimmel Live” following his controversial comments. Antenna, reported in MediaPost, February 2026. This is a useful failure case not because it was a strategic mistake — it was a content rights decision with predictable consequences — but because it demonstrates something important: churn in streaming is increasingly event-driven, not drift-driven.
The implication for operators: the monitoring stack built for gradual subscriber erosion doesn’t catch event-triggered spikes until they’ve already happened. By the time the dashboard shows the problem, the cancellations are done. The cost asymmetry is real: Disney likely spent weeks in reacquisition campaigns to recover what one programming decision lost in days.
No independent audit of the reacquisition cost was published. Treat the cost dimension as directional, not quantified.
YouTube Is Winning TV. Not Streaming. TV.
This one deserves its own framing because the scale is strange. As of April 2025, YouTube (including YouTube TV) commanded 28% of US streaming minutes — nearly double Netflix’s 15%. MoffettNathanson Research analysis of Nielsen data, April 2025. YouTube TV (virtual MVPD) contributed 4% of the 28% total. Excludes YouTube Music. Four years ago Netflix led that category with 26% and YouTube had a fraction of that.
And Nielsen’s Gauge for April 2025 put YouTube at 12.4% of all US TV consumption — not streaming. All TV. That beat its own record set the previous month. Equity analysts expect YouTube to surpass Disney as the largest media company by total revenue in 2025, at $54.2 billion annually. That’s not a streaming story. That’s a TV story.
YouTube’s TV dominance doesn’t just take viewership from Netflix — it degrades Netflix’s leverage with advertisers who want premium CTV inventory. The more viewing time YouTube captures on the living room screen, the more it can price-compress the rest of the CTV ad market by offering scale that no single premium SVOD service can match. The thing that makes this hard to see in real time: Netflix’s dashboard shows ad revenue growing (it is), while the mechanism that will eventually cap that growth is consolidating on a different platform’s balance sheet.
Worth noting: streaming overall — not just YouTube — hit 44.3% of all US TV consumption in April 2025, versus 38.4% a year earlier. Nielsen Gauge, April 2025. Linear TV is losing about 6 share points per year right now. That math doesn’t improve for cable.
Netflix’s Ad Tier: What the Numbers Actually Mean
Netflix has been telling investors it would double ad revenue in 2025, after doubling it in 2024. The Q4 2024 earnings call confirmed it doubled year-over-year in 2024, and co-CEO Gregory Peters noted ad-supported plans accounted for 55% of new signups in the 12 markets where the tier is available. Third-quarter 2025 results showed revenue of $11.51 billion, up 17.2% year-over-year, with Netflix calling it its “strongest advertising quarter to date.” Zacks/Yahoo Finance analysis of Netflix Q3 2025 earnings. Netflix does not break out ad revenue as a separate line item in its public filings, which makes independent verification of the absolute figure impossible.
The complicating data point — which analyst Ian Whittaker flagged after the Q4 2024 call — is that Netflix never disclosed the absolute ad revenue number. When a company doubles something and calls it “solid,” the absolute base matters. eMarketer estimates Netflix’s 2025 ad revenue at approximately $2.07 billion — up nearly 50% year-over-year, which is strong, but still trailing Hulu and YouTube on CTV ad revenue. eMarketer, October 2025. eMarketer’s figures are modeled estimates, not reported financials. Netflix does not publish ad revenue separately.
“45% of Netflix US households watch on the ad tier. That’s almost half the install base taking a product that didn’t exist three years ago.”
Editorial synthesis — sources: Comscore 2025 State of Streaming Report, October 2025; Netflix Q4 2024 earnings; eMarketer, October 2025Comscore’s 2025 State of Streaming Report, released October 2025, put 45% of Netflix US households on the ad tier as of August 2025 — up from 34% a year earlier. Comscore, October 29, 2025. Comscore measurement panel. “US households” means viewing households in Comscore’s panel, not total global accounts. That growth rate — eleven percentage points in twelve months — suggests the mix will continue shifting through 2026.
Netflix keeps ad loads at 4 to 5 minutes per hour. At CPMs of $20–$30 (estimated), the average ad-tier viewer sees 240–300 ads per month. The arithmetic on per-subscriber ad economics, even at current fill rates, suggests the ad tier approaches but doesn’t yet match the revenue per user of a standard subscription. nScreenMedia, October 2025. Fill rate estimated at 45%; CPM range from industry estimates, not Netflix disclosures. Treat as directional. That gap narrows as the ad business matures.
FAST’s 43% Growth Is Real — And the Caveat Matters
The Comscore report confirmed that total hours on major free ad-supported streaming services grew 43% year-over-year. That’s a real number from a credible measurement company, not a vendor press release. Comscore 2025 State of Streaming Report, October 29, 2025. “Major” FAST services — Comscore does not disclose the full list of services included. Percentage is hours-based, not revenue-based. Hours growth in free services can reflect value-seeking behavior rather than preference.
The caveat: FAST growth in hours doesn’t map linearly to FAST growth in revenue. FAST channels are free; they monetize through advertising. And the CPM rates on FAST inventory are meaningfully lower than on premium SVOD ad tiers. A viewer-hour on Pluto TV is worth less to an advertiser than a viewer-hour on Netflix with purchase-intent targeting. The 43% growth figure is directionally correct. It doesn’t tell you the revenue trajectory without knowing CPM trends and fill rates, neither of which Comscore published.
| Platform type | 2025 churn (monthly) | Ad tier / FAST share | Primary growth driver | ⚠ Adversarial note |
|---|---|---|---|---|
| Netflix | ~1.8% gross | 45% of US HH on ad tier | Ad tier adoption + live events | Ad revenue ($2B est.) still trails Hulu / YouTube on CTV. Fill rate estimated ~45% in 2025. |
| Premium SVOD (avg) | 4.6% gross / ~2.5% net | 57% of Q1 2025 adds on ad tier | Ad-supported tier launches | Sports SVOD declined 1% YoY in Q2. Specialty churn still 6.6%. |
| FAST channels | N/A (free services) | 100% ad-supported | +43% hours YoY (Comscore) | Hours growth ≠ revenue growth. FAST CPMs lower than premium AVOD. Revenue trajectory unconfirmed. |
| YouTube (CTV) | N/A (free + subscription) | Primarily ad-supported | 28% of US streaming minutes (incl. YT TV) | YouTube’s CTV dominance compresses ad pricing across the CTV market. Not captured in platform-level churn metrics. |
| Sports SVOD | Up to 12% (post-NFL) | Declining — −1% YoY subs | Event-driven acquisition | Cyclical churn spikes are structural, not manageable through conventional retention tactics. |
The Thing Nobody Is Saying Out Loud
Here’s what you get when you read Antenna, Comscore, Nielsen, and Omdia together rather than separately: the streaming industry in 2025 is simultaneously growing (by hours, by ad revenue, by sheer number of services) and structurally converging on a model where the best-positioned players are the ones who already have the advertising infrastructure. YouTube built that infrastructure over fifteen years. Netflix is building it now. Everyone else is either partnering with it, buying it, or hoping their content is sticky enough to not need it.
No single source says this. Antenna tracks churn and subscriptions; it doesn’t analyze CTV ad market dynamics. Comscore measures hours and platform share; it doesn’t model what 43% FAST growth means for premium AVOD CPMs. Nielsen tracks viewing share; it doesn’t connect YouTube’s TV dominance to Netflix’s long-term ad ceiling. The synthesis requires all three. The conclusion — that the streaming ad market is bifurcating between platforms with mature ad tech and platforms still building it — isn’t one any of them published.
Caveat, because it’s warranted: this is a structural argument based on directional data. The revenue figures on Netflix’s ad business are modeled, not reported. The CPM dynamics on FAST are estimated. Treat the synthesis as a strong hypothesis, not a confirmed finding.
The thesis-complicating piece: Antenna reported total SVOD subscriptions at 339 million in Q2 2025, up 10% year-over-year, but growth is cooling — specialty SVOD grew at 12%, roughly half the pace of 2024. Antenna State of Subscriptions, Q2 2025. US data only. The ad-layer thesis doesn’t fully explain subscription growth slowdown because subscription growth has slowed across platforms with and without ad tiers. Content saturation and subscriber ceiling effects are also in play. The ad story is real and important. It’s not the whole story.
Also worth naming: the Omdia number ($214.6 billion) differs significantly from Statista’s SVOD-specific figure ($119 billion) and from Mordor Intelligence’s live streaming estimate ($76.86 billion in 2025). These figures measure different things — Omdia includes all online video including advertising-only platforms, Statista counts subscription revenue only, Mordor tracks live streaming as a distinct segment. The $100 billion–$108 billion “live streaming market” figure that circulates in trade press without citation appears to conflate these differently-scoped estimates. Mordor Intelligence’s live streaming figure uses proprietary methodology; it is an industry analyst estimate, not reported market data. Use with appropriate epistemic humility.
For the People Running These Things
Reframe: your churn metric is lying to you
The reframe is not “churn is fine.” It’s that gross churn and net churn are measuring different things, and most internal dashboards report gross. Antenna’s September 2024 data showed Peacock at 7.4% gross churn and 4.0% net churn — a 3.4-point gap that represents resubscribers. If your resubscription rate is invisible to your retention team, you’re optimizing for a metric that overstates your actual problem. Check internally: does your churn dashboard factor in resubscriptions within the same cohort? If not, that’s the first thing to fix.
The specific action that follows from the synthesis: if you don’t have a first-party ad tech stack by 2026, you are renting access to the ad market through someone who does. The content decisions and the ad decisions are starting to interact — the Disney/Kimmel churn spike shows that content choices create ad inventory risk in ways that didn’t exist under pure subscription models.
Stop: running ad-tier and subscription-tier acquisition campaigns with the same creative and targeting. The resubscription opportunity (34% of cancellations return within a year) responds to different messaging than new-subscriber acquisition. If your CRM isn’t segmenting former subscribers with lapsed dates, that’s a gap with a known dollar value attached.The CTV audience is not the streaming audience
YouTube at 28% of US streaming minutes means it has more reach in CTV than any SVOD platform. That matters for media planning in a specific way that isn’t well-articulated in most planning conversations: if you’re buying premium CTV at Netflix CPMs and you’re not buying YouTube CTV at its CPMs, you may be paying for exclusivity that doesn’t purchase the reach you think it does. The 18–34 demographic, which Netflix claims its ad tier “reaches more of than any US broadcast or cable network,” also watches substantial YouTube on connected TV screens. Deduplicated reach across platforms is still a genuine measurement challenge in CTV — most platforms use proprietary metrics that don’t talk to each other cleanly.
The access barrier: cross-platform deduplication in CTV is not solved. Nielsen Digital Ad Ratings, Comscore cross-platform, and platform-native measurement all produce different numbers for the same campaign. Until a unified currency emerges, any reach number a platform sales rep gives you is their number, not an audited number.
Stop: treating FAST as a performance channel and premium AVOD as a brand channel by default. The CPM difference reflects historical pricing power, not necessarily audience quality. Roku’s FAST inventory reaches 90% of US CTV households; the audience quality gap between FAST and premium AVOD is context-dependent, not categorical.The real story of streaming in 2025 isn’t disruption. It’s consolidation of ad infrastructure in the hands of whoever built theirs first. YouTube built it. Netflix is building it. The question for everyone else is whether the content moat is deep enough to matter while the build happens.
I don’t know the answer to that. Data’s still coming in.
- Antenna — “Streaming Enters New Phase of Stable Growth”, June 2025 (Deadline)
- Antenna — Premium Streamers’ Growth Slowed to 7% in 2025, MediaPost, February 2026
- Antenna — State of Subscriptions Q2 2025, Subscription Insider
- Antenna — “A Case for Rethinking Churn” (resubscription analysis, Sept 2024)
- Comscore — 2025 State of Streaming Report, AdWeek exclusive, October 2025
- Comscore — 2025 State of Streaming press release, October 29, 2025
- Nielsen Gauge — YouTube April 2025 all-time high, StreamTV Insider
- MoffettNathanson / Nielsen — YouTube 28% of streaming minutes, MediaPost
- Omdia — Global TV and Video Market to $1 Trillion by 2030, October 2025
- Nielsen Q2 2025 Ad Supported Gauge (via MNTN Research) — 73.6% of TV viewing ad-supported
- eMarketer — Netflix Q3 2025 ad revenue analysis, October 2025
- Netflix Q4 2024 earnings call (via Campaign US) — ad revenue doubling confirmed
- Mordor Intelligence — Live Streaming Market, January 2026 update
- Statista — SVOD market worldwide, $119.09bn 2025 projection
- FutureNow — Streaming Monetization Playbook 2025 →
- FutureNow — AVOD vs FAST: What Advertisers Actually Need to Know →
- FutureNow — CTV Advertising Guide: Buying, Measurement, and What’s Still Broken →
How Your Smart TV Could Be Selling Your Data: An Investigative Analysis
How Gen Alpha Will Work in the Metaverse in 2026
The Meme That Accidentally Changed Politics