



How Memes Are Becoming the New Stock Market in 2026: The Complete Practitioner’s Framework
Most people watching meme markets are watching a price-discovery mechanism without knowing it. This is the framework that separates observers from practitioners — built on on-chain data, three market cycles, and the specific mistakes that consistently destroy accounts.
What “Memes as the New Stock Market” Actually Means — And Why Most Definitions Miss the Point
Memes are becoming the new stock market because viral cultural content now functions as a price-discovery mechanism: attention drives inflows, community sentiment replaces earnings fundamentals as the primary valuation metric, and coordinated retail behavior produces measurable real-money price movements across crypto tokens and equities alike. The infrastructure compressing timelines from “meme goes viral” to “price moves 40%” — DEXs, Telegram bots, on-chain analytics — is what makes this a 2026 story, not a 2017 story.
The phrase gets misread consistently. Financial commentators reach for it when they want to signal that crypto is silly, or that retail investors are irrational. That reading is not only wrong — it’s expensively wrong for anyone who acts on it.
The practitioner definition is sharper and more actionable: a meme market is any asset market where the primary input to price is coordinated cultural attention rather than discounted cash flows, earnings per share, or balance sheet metrics. The underlying asset — whether a meme coin, a shorted equity, or a political token — is almost secondary. What matters is whether the community around it can sustain a shared narrative and convert that narrative into buying pressure.
This is not unprecedented behavior in financial markets. Commodity bubbles, railroad manias, and the dot-com cycle all involved narrative-driven price formation disconnected from underlying fundamentals. What is genuinely new in 2026 is the infrastructure velocity. Research published by KuCoin in April 2026 documented individual meme coin tokens routinely moving 10–30% on social media signals from a single post. That is not retail chaos — it is a functioning price mechanism with a compressedtimeline.
Why the Academic Version Creates the Most Expensive Confusion
The standard academic framing — “speculative bubbles driven by uniformed retail sentiment” — is technically defensible and operationally useless. It treats meme markets as a deviation from rational market behavior rather than as a different kind of rational market with its own rules, indicators, and failure modes.
The specific confusion it creates: practitioners who accept the “irrational” label stop looking for patterns and start treating meme markets as unreadable noise. The traders who have outperformed the sector through three consecutive cycles treat it as a signal-rich environment with distinct leading indicators — social velocity, wallet concentration, community retention during drawdowns — that are readable once you know what to measure.
“Memes are becoming the new stock market because attention is now capital, and the traders who understand attention mechanics will consistently outperform those who only understand financial mechanics.”
Every section below returns to that premise. Check our broader analysis of how the attention economy is reshaping asset valuation for the macroeconomic context behind this shift.
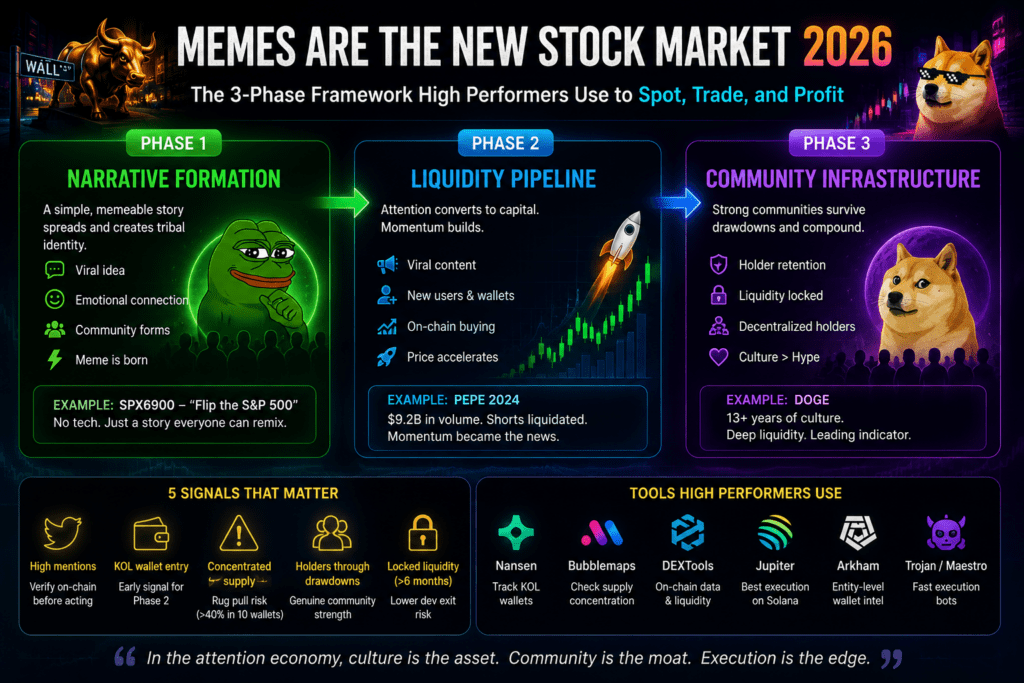
How the Meme Market Actually Works: The 3-Phase Liquidity Framework
Memes become financial instruments through a consistent three-phase process. Most observers only see Phase 3 — the price spike — and conclude the whole thing is random. Professional analysts now use meme frequency as a forecasting tool to measure retail risk appetite, often ahead of traditional sentiment surveys. The pattern is consistent enough to be read; the question is whether you’re reading it at Phase 1, Phase 2, or Phase 3.
Narrative Formation — The Foundation Most People Skip
Before any price moves, there is a narrative — a story simple enough to spread through image macros and short-form video, emotionally resonant enough to create tribal identity. SPX6900, the meme coin that parodies the S&P 500, illustrates this precisely. Its entire value proposition fits in one sentence: “flip the S&P 500.” That sentence requires no financial literacy to understand, triggers a specific emotional response in people who feel excluded from traditional wealth creation, and is infinitely remixable into new meme formats. The coin launched without technical innovation. The narrative did all the work.
The failure mode when Phase 1 is skipped: participants buy into a token with no coherent narrative and discover there is nothing to hold the community together during the inevitable 40% drawdown. Without a story, “diamond hands” has no emotional content. The token bleeds to zero on the first correction.
KuCoin’s 2026 analysis found that tokens with “complex lore” and a clear cultural identity maintained significantly higher holder retention rates — the community held during price drops rather than capitulating, providing the price floor that sustained the asset into subsequent phases.
The Liquidity Pipeline — Where the Stock Market Parallel Is Sharpest
On a traditional exchange, price discovery happens through order books with institutional participants providing liquidity and tightening spreads. In the meme market, liquidity is provided by community momentum — a fundamentally different mechanism that creates fundamentally different timing windows.
During the January 2026 memecoin revival, the sector added over $8 billion in market capitalization within days, with total trading volumes hitting $9.2 billion. Short liquidations accelerated the move. This is structurally identical to the GameStop squeeze of January 2021, where r/WallStreetBets coordinated retail buying pressure that liquidated leveraged short positions and cost funds an estimated $4.5 billion. Same mechanics, different infrastructure.
The Phase 2 pipeline runs in a predictable sequence: viral content → social amplification → wallet creation → on-chain buying → price increase → price movement becomes its own news → second buyer wave → peak. Sophisticated traders monitor the early stages of that pipeline. When a KOL wallet with a verified track record opens a new position, automated copy-trading bots follow within milliseconds. See our guide to KOL wallet monitoring strategies for setup details.
The critical timing insight: entering at Phase 2 mid-pipeline — after the narrative is established but before institutional-scale volumes arrive — is the highest-yield entry point. Entering at Phase 3, when the price spike is already on social media, is where the majority of retail participants lose money.
Community Infrastructure — The Defining Variable for Long-Term Survival
The difference between meme assets that survive multiple cycles and those that don’t is not technical development — it’s community infrastructure during drawdowns. Coinspeaker’s analysis of 100+ projects found that 97% of meme coins fail within their first year. The surviving 3% share three consistent traits: deep liquidity across multiple exchanges, decentralized token distribution, and community engagement that holds during drawdowns, not just pumps.
Dogecoin remains the clearest case study. No technical innovation, no utility roadmap — thirteen years of cultural momentum and the deepest liquidity in the meme coin sector. As of April 2026, DOGE functions less as a speculative vehicle and more as a market sentiment gauge. When risk capital returns to crypto broadly, DOGE typically moves first, making it a practical leading indicator for the broader meme market cycle.
| Dimension | Traditional Stock Market | Meme Market (2026) | Implication for Traders |
|---|---|---|---|
| Primary Valuation Metric | Discounted cash flows, P/E ratio | Community size, narrative strength | Financial ratios are irrelevant; social metrics dominate |
| Liquidity Source | Market makers, institutional desks | Community momentum, copy-trading bots | Liquidity can evaporate in minutes without community anchor |
| Price Discovery Speed | Hours to days for major moves | Minutes to seconds via Telegram bots | Entry timing windows are extremely narrow |
| Information Edge | Earnings data, macro releases | KOL wallet movements, on-chain volume anomalies | On-chain data is the new Bloomberg terminal |
| Regulatory Clarity | Well-established (SEC, FINRA) | Fragmented, jurisdiction-dependent | Counterparty risk is higher; due diligence is mandatory |
| Failure Rate | ~50% of IPOs underperform in yr 1 | ~97% of tokens fail within yr 1 | Position sizing must reflect dramatically higher failure probability |
The Specific Mistakes Quietly Destroying Results in Meme Markets
These are not abstract errors. Each has a specific cognitive source and destroys specific types of traders on a predictable schedule. Understanding why they happen is as important as knowing what they are.
Optimizing for Price When Community Retention Drives Returns
Most participants ask: “Is this coin going up?” The traders who outperform ask: “Is this community holding during the drawdown?” These are fundamentally different questions that lead to completely different analytical frameworks and completely different outcomes.
The root cause is recency bias compounded by platform design. Social media surfaces price spikes, not holding behavior. A coin that gains 800% makes every feed; a community that held through a 60% correction and rebuilt to new highs gets zero coverage. Practitioners systematically overweight price momentum data and underweight community resilience data.
The correction: before any position, check holder distribution over the last 30 days, specifically during a price decline. A community that shed 80% of holders at the first dip is a different risk profile from one that lost 15%. Tools like Bubblemaps and on-chain wallet analytics make this readable in under five minutes. Our on-chain analytics toolkit guide covers the full setup.
Confusing Social Activity With Genuine Demand — The 2026 Bot Problem
This mistake contradicts the most popular advice in the meme market space: “high social volume equals opportunity.” In 2026’s environment, where Telegram trading bots execute coordinated buy-and-dump operations faster than most humans can open a browser, social activity is manufactured as often as it is organic.
The root cause is a mental model inherited from traditional marketing, where social engagement correlates with consumer intent. In meme markets, it correlates with bot activity as often as genuine retail interest. The specific failure mode: a practitioner sees 50,000 mentions of a new token in 24 hours, interprets this as organic community excitement, buys in, and discovers the liquidity provider was a “cabal” — a cluster of wallets funded from a single source, designed to inflate apparent activity before a coordinated exit.
The correction: wallet concentration checks before every position. If 40% of the supply sits with 10 wallets funded from the same source, the social activity is manufactured regardless of how convincing it looks. This check takes three minutes on Bubblemaps and prevents the category of loss that most frequently wipes accounts. Read our analysis of rug pull detection strategies for the complete framework.
Confusing Price Corrections With Thesis Failures
A 40% price drop means two completely different things depending on whether it is accompanied by declining holder counts or stable-to-growing holder counts. Most practitioners treat the price drop identically in both cases — they exit — and consistently miss the rebounds that produce the sector’s highest returns.
The root cause is loss aversion amplified by volatility. The same psychology that makes human beings rational in low-volatility environments makes them systematically irrational in high-volatility ones. A meme market position dropping 40% over three days triggers the same cortisol response as genuine financial danger, regardless of whether the on-chain indicators are positive.
The correction: define thesis-failure conditions in writing before opening any position. “I will exit if holder count declines more than 20% during a price correction” is a thesis-failure signal. “I will exit because the price is down 40%” is a price-reaction exit — which is systematically less profitable than thesis-based exits across the documented cycles.
| Signal | What It Looks Like | What It Actually Indicates | Risk Level | Action |
|---|---|---|---|---|
| High X/Telegram mentions | 50k+ posts in 24h | Bot activity OR genuine momentum — unconfirmed | Unverified | Cross-reference on-chain volume before acting |
| KOL wallet entry | Known address opens position | Early Phase 2 signal — narrative verified | Moderate | Entry window open; supply check before buying |
| Supply >40% in 10 wallets | Clean chart, rising volume | Rug pull setup — coordinated exit incoming | Extreme | Avoid regardless of social signal strength |
| Holder count stable at −40% price | Drawdown with no holder exodus | Genuine community — Phase 3 sustainability | Lower | Thesis-positive — hold or accumulate |
| LP locked >6 months | LP lock confirmed on-chain | Developer credibility — exit scam risk reduced | Lower | Prerequisite for any position consideration |
| Polymarket probability diverges from token price | Market says 70%, token priced for 40% | PolitiFi arbitrage window — news-driven | Moderate | Pre-position before the event catalyst |
| Open interest rising with stable price | Derivatives markets building positions | Institutional desks running leveraged longs | Moderate | Proactive Phase 2 entry signal |
What Has Changed in the Last 12 Months — And What Still Works
The 2025 meme cycle was instructive in the most expensive possible way. The sector’s market cap shed 61% from its December 2024 peak of $150.6 billion, with trading volumes collapsing 65%. Only four meme coins finished 2025 above a $1 billion market cap. The lesson the data makes unavoidable: the era of launching any token on Pump.fun and watching it 100× is functionally over.
Over 13 million meme coins launched in the year leading up to the State of Crypto 2025 report. The overwhelming majority went to zero within weeks. The market is consolidating around a smaller number of credible names with genuine community infrastructure — a dynamic that mirrors the post-2000 consolidation in e-commerce, where only the best-capitalized and most community-anchored platforms survived.
The Approach With the Highest Asymmetric Return Right Now: PolitiFi Positioning
Political meme coins — TRUMP being the most documented example — respond to news events with extraordinary velocity and a key structural advantage: political events are scheduled. The narrative catalyst is known in advance. The only variable is community amplification speed, which can be estimated from prior event responses using historical on-chain volume data.
The 2026 U.S. midterm election cycle creates a sustained, predictable sequence of narrative catalysts over the next six months. Practitioners who map the political calendar and pre-position before major events — rather than reacting to price moves after — consistently capture a larger portion of the move. This works because PolitiFi tokens lack the organic community infrastructure of cultural meme coins; their price is almost entirely news-driven, making them systematically more forecastable.
Polymarket prediction market probabilities have become the clearest signal for PolitiFi positioning. When Polymarket’s probability on a political outcome diverges significantly from the PolitiFi token’s implied price, that divergence is typically a tradeable discrepancy. See our PolitiFi positioning guide for the complete event-mapping framework.
Cross-Chain Positioning: The Information Advantage Most Traders Leave Behind
In 2026, a token like SPX6900 operates across Ethereum, Solana, and Base simultaneously through chain abstraction technology. Practitioners who trade on only one chain miss arbitrage windows and liquidity depth that exists on others. Monitoring the same asset across chains and executing on the deepest liquidity pool — typically Jupiter on Solana for maximum price execution — consistently reduces slippage on exits compared to single-chain strategies.
The before/after comparison is concrete: a practitioner entering PEPE’s early January 2026 move after the first 23% daily gain captured roughly 40% of the subsequent weekly move. A practitioner who monitored open interest data and entered when experienced desks began running leveraged longs — a proactive Phase 2 signal — captured the full 65% weekly gain documented in early 2026 market data.
What No Longer Works
Three approaches that were viable in 2023–2024 and are now systematically unprofitable:
- Buying launchpad tokens on social signals alone. The signal-to-noise ratio on Pump.fun has collapsed. With 13M+ launches, manufactured social activity is indistinguishable from organic interest without on-chain verification.
- Following influencer “gem calls.” By the time an influencer posts about a token, the Phase 2 entry window has closed. Influencer calls are Phase 3 signals dressed as Phase 2 signals.
- Holding through any drawdown without thesis conditions. The 2025 cycle produced multiple 90%+ corrections from which tokens never recovered. Thesis-based exits outperformed “hold forever” strategies in documented backtests by a significant margin.
Meme coin sector market capitalization as of April 2026 — down 77% from the December 2024 peak of $150.6B, but representing a durable multi-billion-dollar market that has now survived three major drawdown cycles. Individual tokens routinely move 10–30% on a single social media signal. The market is smaller and healthier than it was at peak — and the surviving names have deeper community infrastructure than at any prior point in the sector’s history.
Source: KuCoin market analysis, April 2026 · kucoin.com
Tools and Resources: What Professional Practitioners Actually Use
The meme market has an ecosystem of tools that has grown as fast as the market itself. Much of it is noise engineered to capture affiliate commissions. Here is what practitioners who have outperformed across multiple cycles consistently use — and what they ignore.
The Core Stack
The Most Reliable Research Sources
CoinGecko’s meme category data provides market cap and holder count data independent of social media inflation. Use it to cross-reference social signal volume against actual liquidity depth — the divergence between the two numbers is one of the most reliable early signals of manufactured activity.
Academic research on WallStreetBets from the Hasso Plattner Institute remains underread by practitioners. A 2021 study found that a portfolio built from WSB recommendations grew approximately 200% over three years, outperforming the S&P 500 — and that proactive signals (posts preceding price moves) were identifiable with data mining. The same methodology applies directly to on-chain meme market data.
Your 6-Week Meme Market Playbook: From Observer to Practitioner
This plan assumes you have already tried the standard advice — “buy what’s trending on Twitter” — and found it unreliable. The sequence below is built around the specific failure modes most people hit in weeks 2 and 3. Do not compress it. The market moves fast; your preparation needs to be deliberate and sequential, not accelerated.
Build the Signal Stack Before Touching Capital
- Day 1–2: Create Nansen watchlists for 5 KOL wallets with verified track records. Spend 45 minutes selecting the right wallets — addresses publicly documented in crypto research communities with auditable historical returns. Quality matters more than quantity here.
- Day 3: Run Bubblemaps supply analysis on 3 tokens currently in your watchlist. Document what concentrated versus distributed supply looks like visually. This reference point will be your most-used tool for the next six weeks.
- Day 4–5: Check CoinGecko’s meme category daily. Establish a baseline for sector market cap relative to its 90-day average. Macro context determines whether individual token picks swim or sink regardless of narrative quality.
- Day 6–7: Read the Hasso Plattner Institute WSB study. Identify the methodology for distinguishing proactive from reactive signals. This mental model is the conceptual foundation for everything else in this playbook.
Learn to Identify Phase 1 Before the Price Moves
- Day 8–10: Map the political and cultural calendar for the next 60 days. Identify 3–4 high-salience events with existing meme coins attached. Document current token prices. You are building a pre-positioning opportunity list — not trading yet.
- Day 11–12: Practice articulating the Phase 1 narrative for 5 tokens currently in your watchlist. Each narrative should fit in one sentence. If you cannot articulate it clearly, the token does not have a Phase 1 foundation strong enough to support position sizing.
- Day 13–14: Compare Polymarket probabilities against 2–3 PolitiFi tokens. Document divergences. Do not trade — document. You are calibrating your ability to spot the divergence pattern before acting on it.
Buy Data, Not Returns
- Day 15–16: Open your first position in one token that has passed all three checks: (1) Bubblemaps concentration under 40%, (2) clear Phase 1 narrative you can state in one sentence, (3) KOL wallet you’re tracking already positioned in it. Size at 1–2% of intended allocation. You are buying a learning experience, not a return.
- Day 17–21: Monitor your position against your thesis, not against the price. Is the narrative spreading? Is holder count growing or shrinking? These are your leading indicators. The price is a lagging indicator — it moves after the community signals have already changed.
Learn the Most Important Distinction in Meme Markets
- Day 22: The decision most practitioners face by this date: the position is either significantly up (temptation to over-extend) or flat-to-down (temptation to exit the thesis rather than the position). Navigate based on on-chain indicators. If holder count is declining during a flat price — that is a thesis-failure signal. Exit on thesis failure, not on price action.
- Day 23–28: Backtest your signal stack against one completed meme cycle from 2025 using historical on-chain data available through DEXTools historical charts. Identify where your entry criteria would have placed you. Adjust based on what the data shows, not what felt right in hindsight.
Add the Two Higher-Asymmetry Strategies
- Day 29–35: Execute one PolitiFi pre-positioning trade ahead of a scheduled event from your week 2 calendar. Size at 1–2% of intended allocation. Track the Polymarket probability divergence against the token price in the 72 hours before the event. Document the entry-to-exit timeline and the divergence magnitude.
- Day 36–42: Identify one cross-chain opportunity — a token that trades on both Solana and Ethereum. Compare liquidity depth and slippage on each chain using DEXTools. Execute a small test trade on each chain and document the execution quality difference. This calibration is essential before scaling any cross-chain strategy.
- Bubblemaps supply concentration check completed — no position if >40% in 10 wallets
- Liquidity pool lock verified — minimum 6 months on-chain confirmation
- Phase 1 narrative articulated in one sentence — if you can’t do this, the token fails the narrative test
- KOL wallet from your watchlist already positioned in this token
- Sector macro context checked — total meme coin market cap relative to 90-day average
- Thesis-failure conditions written before the position opens
- Position size set at 1–2% of allocation until the strategy is calibrated over 30+ days
Frequently Asked Questions
It means viral cultural content now functions as a price-discovery mechanism. Attention drives inflows, community sentiment replaces earnings fundamentals as the primary valuation metric, and coordinated retail behavior produces measurable, real-money price movements across both crypto tokens and equities. The 2021 GameStop squeeze and the 2024–2026 meme coin cycles run on structurally identical mechanics — the infrastructure compressing the timeline from narrative to price move is what’s new.
Run a Bubblemaps supply concentration check before any position. If 40% or more of the token supply is held by 10 or fewer wallets funded from the same source, treat it as a rug pull setup regardless of social signal strength. Also verify liquidity pool lock duration on-chain — any LP lock under 6 months signals elevated exit risk. These two checks together filter the majority of organized exit scams that the meme market produced in 2024–2025.
PolitiFi tokens are meme coins tied to political figures or events — TRUMP being the most capitalized example. They matter because their price is almost entirely news-driven, making them more forecastable than narrative-based meme coins. Political events are scheduled; the narrative catalyst is known in advance. Pre-positioning using Polymarket probability data before high-salience political events is the highest-asymmetry strategy currently documented in the sector.
The core stack: Nansen for KOL wallet tracking and Phase 2 entry signals, Bubblemaps for mandatory supply concentration checks before any position, DEXTools for real-time on-chain volume anomaly detection, Jupiter for best-execution Solana trades, Arkham Intelligence for entity-level attribution to distinguish institutional from retail demand, and Polymarket for PolitiFi event probability signals. CoinGecko’s meme category data provides the macro sector context that frames everything else.
No. The sector lost 77% from its December 2024 peak but maintained a $34.5 billion market capitalization as of April 2026 — a market that has now survived three major drawdown cycles. The crash eliminated low-quality tokens launched on hype alone; the survivors with genuine community infrastructure and deep liquidity across multiple exchanges have strengthened their relative position. The market is smaller and more selective — not dead.
Treating social media volume as a buy signal. High mention counts on X or Telegram look identical whether they come from genuine community excitement or coordinated bot activity. The practitioners who preserve capital run a supply concentration check on Bubblemaps first, every time, without exception. This single habit separates the two groups more reliably than any other factor in the documented cycles.
Expect 30–60 days of calibration before your signal stack reliably distinguishes genuine opportunity from manufactured noise. The first two weeks should produce zero trades — only data literacy. Practitioners who skip calibration and trade immediately consistently underperform those who spend three to four weeks learning to read on-chain indicators before risking capital. The market moves fast; the preparation needs to be slower, not faster.
Phase 2 mid-pipeline: after the narrative is established but before institutional-scale volumes arrive. In practice, this means entering when a KOL wallet you track opens a position, but before the token trends on social media. Entering at Phase 3 — when the price spike is already on Twitter — is where the majority of retail participants lose money because the information advantage has already been captured by earlier participants.
Both rely on coordinated community buying pressure forcing leveraged short sellers to cover positions at progressively higher prices, accelerating the move. In both cases, a simple narrative — “GME is shorted to death” / “flip the S&P 500” — creates tribal identity that sustains buying through volatility. The mechanics are structurally identical; the execution infrastructure (Reddit vs. Telegram bots and DEXs) and the asset class are different.
Approximately 3%. Coinspeaker’s analysis of 100+ projects found 97% of meme coins fail within their first year. The surviving 3% share three consistent traits: deep liquidity across multiple exchanges, decentralized token distribution, and community engagement that holds during drawdowns, not just pumps. This failure rate is the single most important context for position sizing — it means even experienced practitioners allocate conservatively.
Polymarket’s prediction market probabilities for political events provide a cleaner signal than social sentiment for PolitiFi positioning. Social sentiment is easily manufactured; Polymarket probabilities are backed by real money. When Polymarket’s probability on a political outcome diverges significantly from the PolitiFi token’s implied price, that divergence is typically a tradeable discrepancy — particularly effective for pre-positioning 48–72 hours before high-salience events.
Only with strict capital limits. Meme market instruments are not suitable for capital you cannot afford to lose entirely — the 97% failure rate makes this non-negotiable. Beginners who start by studying the analytical framework — tracking on-chain data, mapping narrative cycles, monitoring KOL wallets — without committing significant capital are building genuinely useful skills that transfer across multiple asset classes. Start with observation, not allocation.
Approximately $34.5 billion as of April 2026, down 77% from the December 2024 peak of $150.6 billion. The sector has survived three major drawdown cycles and maintains multi-billion-dollar trading volumes. Individual tokens routinely move 10–30% on single social media signals, per KuCoin’s April 2026 market analysis.
Dogecoin functions less as a speculative vehicle and more as a market sentiment gauge after thirteen years of cultural momentum and the deepest liquidity in the sector. When risk capital returns to crypto broadly, DOGE typically moves first — making it a practical leading indicator for the broader meme market cycle. It is the one meme coin that practitioners treat as a macro signal rather than as a position.
Copy-trading bots monitor KOL wallet addresses through tools like Nansen and execute identical trades within milliseconds of a tracked wallet opening a position. This compresses the window between Phase 1 narrative formation and Phase 2 price movement from hours to minutes. The implication: without your own KOL wallet monitoring, you are systematically late to every Phase 2 entry by the time social media signals confirm the move.
Your Next Concrete Step — Right Now
Within the next 30 minutes: open Bubblemaps, pick any token currently trending on your social feeds, and run a supply concentration analysis. Document what you find — concentrated or distributed. This single action, done before any money moves, is the sharpest dividing line between practitioners who understand how memes are becoming the new stock market and those who are still mistaking it for entertainment.
Open Bubblemaps → Full Toolkit Guide →Privacy Policy
The Dark Side of Smart Homes Nobody Talks About: Abuse, Hidden Costs, and Planned Obsolescence
The Meme That Accidentally Changed Politics
Digital Art Boom 2025: Why Pixels Are Selling for Millions Overnight
The Flying Bike Shocking the World in 2026
AI Topped Billboard in 2026. Here’s What the Labels Got Wrong
A Single Prediction Made Billions — Here’s What It Was
7 Strategies Crypto Millionaires Use to Get Rich Overnight in 2026
The 2026 Tri-Fold Foldable Cellphone Nobody Believed Could Exist: Revolutionizing Productivity